Google Maps Animated Polyline
CSS
GoogleMaps
JavaScript
Website
jQuery

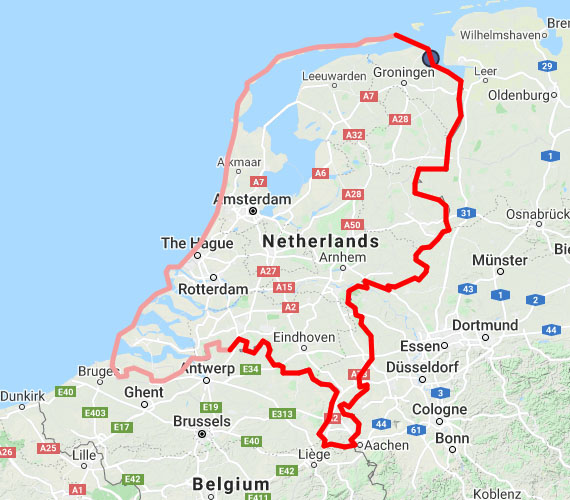
This demo shows two ways of showing the direction of a Google Maps PolyLine. One method is by moving an icon along the path of the PolyLine. The other method is by drawing another PolyLine on top of the other one section at a time to create an animation.
Download the JavaScript (Minified)
View source on GitHubCode Snippets
var map;
var polyline;
var bounds;
var linePartArr = [];

//timeout because jquery script is loaded later that this js file on this page
setTimeout(function () {
    initializePolylineMap(52.52000, 5.28662);
}, 50);

//create the map
function initializePolylineMap(lat, lng) {
    //coord for the center of the map
    var startpos = new google.maps.LatLng(lat, lng);

    //map options
    var options = {
        zoom: 8,
        center: startpos,
        zoomControl: true,
        mapTypeControl: false,
        scaleControl: false,
        streetViewControl: false,
        rotateControl: false,
        fullscreenControl: false,
        mapTypeId: google.maps.MapTypeId.TERRAIN
    };

    //start the map
    map = new google.maps.Map(document.getElementById('map_canvas'), options);

    //add bounds
    bounds = new google.maps.LatLngBounds();

    //create the polyline
    createPolyLine();

    //animate the polyline drawing
    animatePolyline();

    //animate the icon
    animateIcon();

    //make an array of maps coordinates for the bounds
    for (var i = 0; i < lineCoordinates.length; i++) {
        var pos = new google.maps.LatLng(lineCoordinates[i].lat, lineCoordinates[i].lng);
        bounds.extend(pos);
    }

    //fit the map within the bounds
    map.fitBounds(bounds);
}


//add a polyline to the map
function createPolyLine() {
    //create a symbol to animate along the route
    var lineSymbol = {
        path: google.maps.SymbolPath.CIRCLE,
        scale: 8,
        fillColor: '#566895',
        fillOpacity: 1,
        strokeColor: '#282c41',
        strokeOpacity: 1,
        strokeWeight: 2
    };

    //create a polyline
    polyline = new google.maps.Polyline({
        path: lineCoordinates,
        strokeColor: '#f39e9e',
        strokeWeight: 5,
        icons: [
            {
                icon: lineSymbol,
                offset: '100%'
            },
        ],
        map: map
    });
}


//animate the icon on the map
function animateIcon() {
    var lineOffset = 0;

    //experiment with the speed based on the length of the line
    var iconSpeed = 0.2;

    //move the icon
    setInterval(function () {
        lineOffset = (lineOffset + iconSpeed) % 200;
        var lineIcon = polyline.get('icons');
        lineIcon[0].offset = lineOffset / 2 + '%';
        polyline.set('icons', lineIcon);
    }, 20);
}


//animate the drawing of the polyline
function animatePolyline() {
    var i = 0;
    var pause = false;
    var pauseLineRemove = 1500;
    var pauseRedrawLine = 1000;

    //experiment with the speed based on the total parts in the line
    var drawSpeed = 50;

    setInterval(function () {

        //check if the end of the array is reached
        if (i + 1 == lineCoordinates.length && !pause) {
            pause = true;

            //remove all the line parts, optionally with a delay to keep the fully drawn line on the map for a while
            setTimeout(function () {
                for (var j = 0; j < linePartArr.length; j++) {
                    linePartArr[j].setMap(null);
                }

                linePartArr = [];
            }, pauseLineRemove);

            //delay the drawing of the next animated line
            setTimeout(function () {
                pause = false;
                i = 0;
            }, pauseRedrawLine + pauseLineRemove);
        }

        //create a line part between the current and next coordinate
        if (!pause) {
            var part = [];
            part.push(lineCoordinates[i]);
            part.push(lineCoordinates[i + 1]);

            //create a polyline
            var linePart = new google.maps.Polyline({
                path: part,
                strokeColor: '#ff0000',
                strokeOpacity: 1,
                strokeWeight: 5,
                zIndex: i + 2,
                map: map
            });

            //add the polyline to an array
            linePartArr.push(linePart);

            i++;
        }

    }, drawSpeed);
}
In this example the Array lineCoordinates with the coordinates of the PolyLine is in the following format.
var lineCoordinates = [
    { lat: 53.531003, lng: 6.483307 },
    { lat: 53.441118, lng: 6.834869 },
    { lat: 53.339565, lng: 6.884308 }
];